The Challenge
- Energy costs represent 30% of building operating expenses
- Lack of visibility into consumption patterns
- Inefficient HVAC systems running 24/7
- No way to fairly bill tenants for actual electricity and gas usage
- Increasing pressure for CO2 reduction
Our Solution
- Real-time electricity and gas metering & monitoring
- Smart sub-metering for individual units
- HVAC optimization based on occupancy
- Automated alerts for anomalies
- Detailed reporting for ESG compliance

Electricity Metering
Monitor main feeds and individual circuits. Track peak demand and identify energy waste.

Gas Metering & Heating
Monitor gas consumption, boiler efficiency, and heating distribution systems.

HVAC Optimization
Smart control of heating, cooling, and ventilation based on occupancy and weather.
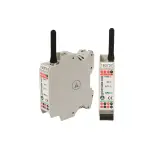
Key Energy Indicators
kWh/m²
Energy Intensity
Track consumption per square meter over time
€/kWh
Cost per Unit
Monitor energy pricing and tariff optimization
Peak kW
Demand Management
Track and reduce peak demand charges
CO2 kg
Carbon Footprint
Monitor emissions for ESG reporting
%
HVAC Efficiency
System performance vs. optimal conditions
€
Monthly Savings
Cost reduction compared to baseline
Hours
Equipment Runtime
Track system operating hours and cycles
Score
Energy Rating
Building energy performance benchmark
Dashboards & Reports
Daily Energy Dashboard
Real-time consumption, costs, and efficiency metrics.
Updated every 10-15 minutes.
Weekly Performance Summary
Trends, anomalies, and optimization recommendations. Automated email delivery.Monthly Cost Analysis
Detailed breakdown by area, system, and time period.Weekday and Seasons Comparison
Analysis of consumptions by day of the week and by season.Weekly Performance Summary
Trends, anomalies, and optimization recommendationsPeak & Ground consumption analysis
Analysis of building energy use patterns, comparing peak demand with baseline (ground) consumption.Tenant Billing Report
Individual unit consumption and cost allocation.Annual ESG Report
Carbon footprint, sustainability metrics, and complianceReturn on Investment
20-30%
12-18
Months Payback Period
25%
CO2 Footprint Reduction
Recommended Energy Metering Sensors
Energy Efficiency Latest News

Real Pulse by IOT Factory presented at Pollutec 2025
Pollutec brings together stakeholders from the energy, water, air quality, and waste management sectors to develop innovative solutions to reduce the environmental impact of human and industrial activities.

How Smart Monitoring Cut Electricity Use by 38% in an Office Building
Discover how simple IoT-based monitoring reduced energy use by 38% in a 460 m² office — proving that measuring is the first step toward efficiency.